Image courtesy of Me
Circuit Breaker Visualizer
You can't throw a stick at a discussion on reliability without hitting someone talking about the circuit breaker pattern. Martin Fowler has a nice writeup on Circuit Breakers that you might want to read to familiarize yourself.
Here's the main point of a circuit breaker in software:
The basic idea behind the circuit breaker is very simple. You wrap a protected function call in a circuit breaker object, which monitors for failures. Once the failures reach a certain threshold, the circuit breaker trips, and all further calls to the circuit breaker return with an error, without the protected call being made at all. Usually you'll also want some kind of monitor alert if the circuit breaker trips.
Martin Fowler from http://martinfowler.com/bliki/CircuitBreaker.html
This post picks up from the last sentence in the above quote. I've seen countless examples of implementing a circuit breaker in code. I've seen a dozen Java classes, fifteen C# classes, and four Ruby poems each with slightly different implementations of the circuit breaker pattern. Until recently I didn't see any examples of visualizing or showing the circuit breaker in the UI.
If I can't see it then it doesn't exist
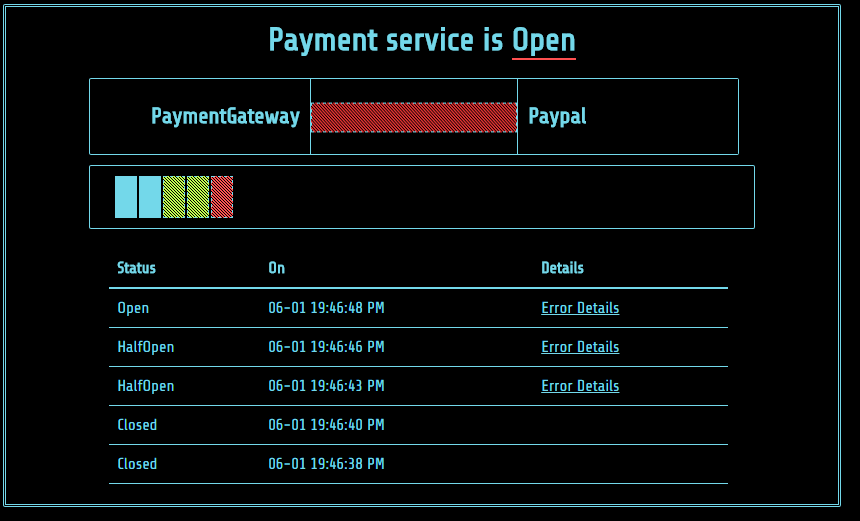
Let's start with a picture of the final product.
Now let's take a look at the main aspects of the design.
Current State
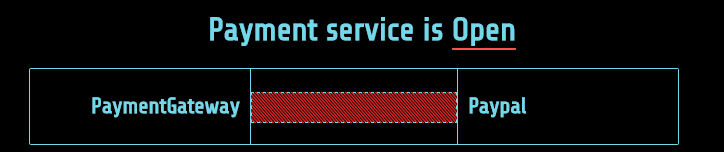
One of the most important aspects of the circuit breaker is the current state. If it is open then something is broken and either your users are seeing a degraded experience or you are losing money or both.
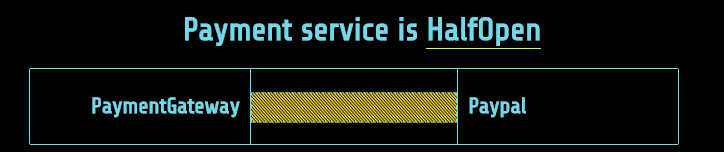
The first part of the visualization is the current state of the breaker. The current state is represented in two ways: text and visually. When things are operating normally there is no special indicator but when the state of the circuit breaker is half-open or open we try to indicate something unusual by underlining the state text with yellow and red respectively.
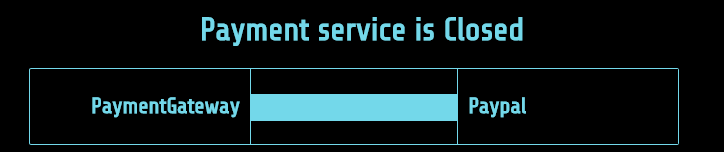
The same information is also shown visually in the fuse indicator. This plays a bit to a skeumorphic design where a fuse is a type of circuit breaker. Here we see what two components are connected by the circuit breaker. In the example below there is some code we wrote, the PaymentGateway, calling Paypal's API and our circuit breaker is monitoring that connection.
Closed - Everything is normal
Half Open - Something failed but not enough times to stop us from trying again
Open - Failed enough times to open the circuit and prevent us trying again for a while
State History
Since we are watching what the system is doing we want to keep track of the history of state changes so we can troubleshoot issues while things are happening. To support this there are again two complementary representations of the history: visual indicators and a data table.
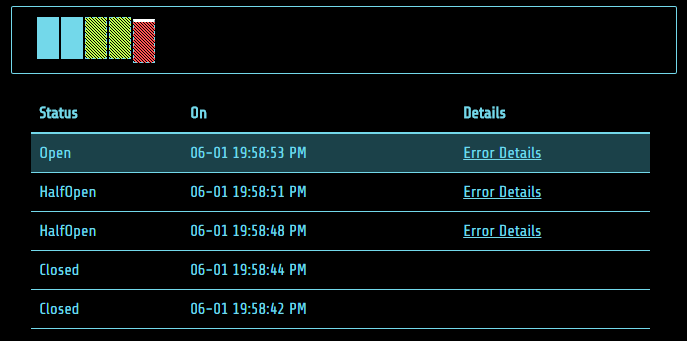
The visual indicators are smaller versions of the fuse we use in the current state. This gives a visual and colorful way to represent the history as it happens. The most recent status is the furthest on the right going back in time to the left.
The data table shows the state and the time it changed. When the state is half-open or open the details column contains a link to more information on the error. This can help track what issue caused the breaker state to change.
The visual indicator and data table are correlated so that when you hover over one or the other its corresponding alternate is highlighted. In the below example you can see how the latest state of open is highlighted in the table and the visual indicator for that has a small border and is slightly proud of the others.
Circuit breaker history showing latest state changes
Caution: Moving Parts
Up until now we have been looking at picture of this visualization. However, in real life this would be a dynamic and changing visualization. It would be refreshing and growing as the state changes and the system is used.
To see a simulation of this visualization responding to real-time data click here.
You can use the checkboxes at the top of the demo to add experimental elements like using animations or sound effects to draw more attention to the state changes.
Where can we go from here?
This was one take on a circuit breaker visualization. I'll admit it was a bit skeumorphic and depending on your taste that may not be what you are into. There is plenty of room for improvement and I would love to hear suggestions. After building this I came up with all sorts of questions like "Can I put a button on the visualzation that would change the state of the circuit breaker in the system?" and "How would a group of these show on a dashboard?". In terms of code quality it was a fun prototype to build but it's not production ready. It would probably be worth bringing d3.js in to handle the visualizations instead of re-inventing the wheel like I did. There is definitely room to improve the responsiveness of the design so that it shows up well on all screen sizes instead of just working on desktop as it does now.
Other options include taking a cue from Nextflix's design and showing more statistical information like error rate and throughput. I held off on adding those in since I wanted to focus purely on the circuit breaker and not the surrounding data flowing through the system.
Let me know if you run into any issues with the live demo or you have any suggestions. Here's to visibly reliable systems!
Further resources
- ReleaseIt! - the book that popularized the circuit breaker pattern
- A good definition of the circuit breaker pattern
- Microsoft's example of circuit breaker pattern
- Nextflix detailed usage of circuit breaker and first visualization of it I had come across.
- Nice tech talk by Fog Creek with a video of Netflix's Hystrix dashboard running and visualizing the circuit breaker status.
- Java Actor library Akka's expplanation of the circuit breaker pattern
- Another actor based circuit breaker pattern with video visualizing the breaker