Image courtesy of Me
Show Time
When Things Happen
I recently found myself trying to piece together the events that led up to a certain issue. At some point I realized that just keeping track of them in my head was not good enough and just typing them out left me wanting as I had to re-read and basically re-play the events to myself. Then I realized there is a better way to view events over time - a timeline. Shocking revelation right?
A quick search to see if there was a simple tool that would let me bang together a timeline based on dates and a description led nowhere. To my shock nothing simple and usable showed up. I found Excel plugins that looked like they were created in Excel 95 and some tutorials on 15 easy steps to transform a scatter plot chart in Excel until it resembled a timeline. Then there were the myriad of Timeline-As-A-Service ™ tools that promised to make professional looking timelines but seemed to assume I had hours of time and all sorts of graphics that I wanted to add.
Bewildered and wondering if I would ever find the brutally simple timeline creator I wanted I decided to hack it together myself. Thus Show Time was born.
A Simpler Time
My goals were pretty simple:
- Minimal time investment - I want a timeline not an extensible timeline creating framework
- Low friction - No fancy frameworks, build tools. I want this today even if I use technology from yesterday.
- Easy data entry - Focused on keyboard driven entry of data so I can be in and out of the tool. I don't want to spend time working with the tool I want a timeline.
- Simple timeline control - I don't want to re-invent timelines I just need a simple usable api for one.
- Web based. Preferably static - I would like to host it somewhere easily so I can get to it from anywhere.
Timeline Ahoy
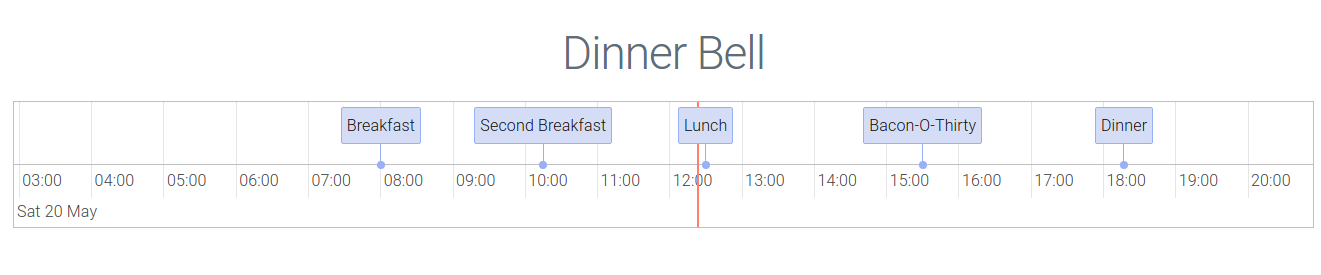
The timeline control I went with was from http://visjs.org/. It fits the simple and just works goal I had not to mention great documentation and easy to understand demos. I dropped that on the page and set to work being able to drive data into it from the UI.
Keyed In
I originally started thinking about having an Excel-like interface to enter the timeline information. Another quick search led me to a plethora of JavaScript based Excel-like components. I tried a couple but none of them gave me the simplicity I wanted in the time I was willing to give them.
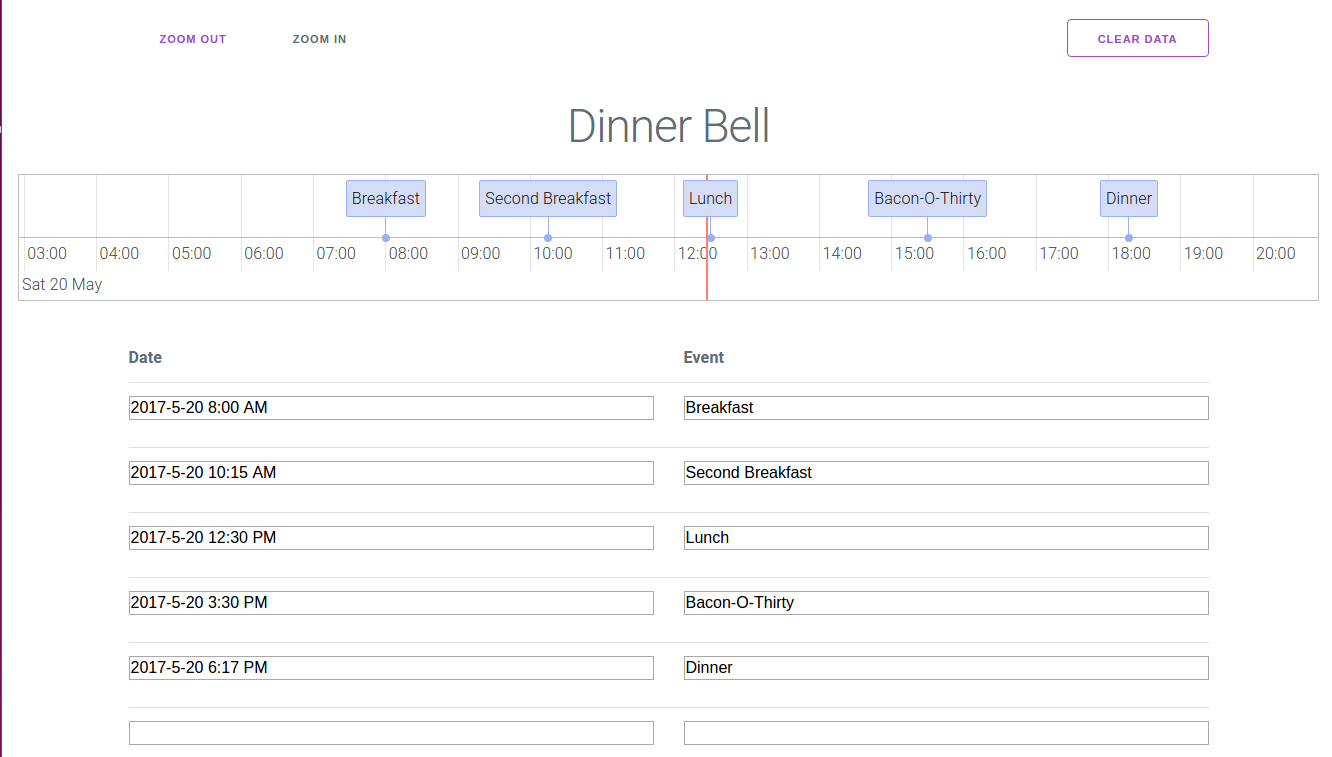
Since my goal was minimal time investment in building this I didn't want to have to spend time learning a complex api just so I can get data into the timeline. So I declared technical bankruptcy and started with the simplest thing - a table of inputs.
This table would let me tab and shift-tab so I could quickly navigate and create or edit events. The tab-based navigation also made it simple to determine when we have run out of room so we can add another row for more info without having to switch to the mouse. Now I can just focus on dumping the events from my head into the timeline.
Style Guide
I brought in http://milligram.io/ to help make things look a bit more presentable. I also added a contenteditable h1 element for the title so you can easily give the timeline some context.
Land Of The Data Lost
The info you enter is auto-saved to localstorage. This makes it less frustrating if you accidentally hit refresh or your browser crashes. It's so basic it's borderline crude but it comes in handy.
What's Next
Now I get to try and enjoy using it. Hopefully it will come in handy when I try to piece together disparate events in the future. It should also make it easier to communicate what I found with other people.
From a technical side the code is like any good prototype - ready to fall over at the mention of a new requirement. If I wanted to make this thing last I would refactor it until it could withstand more than the happy path on the latest browser but first I want to make sure this thing is even valuable. It doesn't make sense building it to last millennia when I'm not sure it will last this afternoon.
No matter what the future holds I learned some things and had fun with it. Feel free to play with it and let me know how it could be better.
Here's to many happy time(line)s ;-)